A practical guide to tracing social media statistics back to their primary sources, verifying methodology, and identifying denominator errors in viral claims.
This article was researched and drafted with AI, then checked and released by a person before it went live. The illustration is AI-generated. Every factual claim links to its source, so you can verify it yourself.
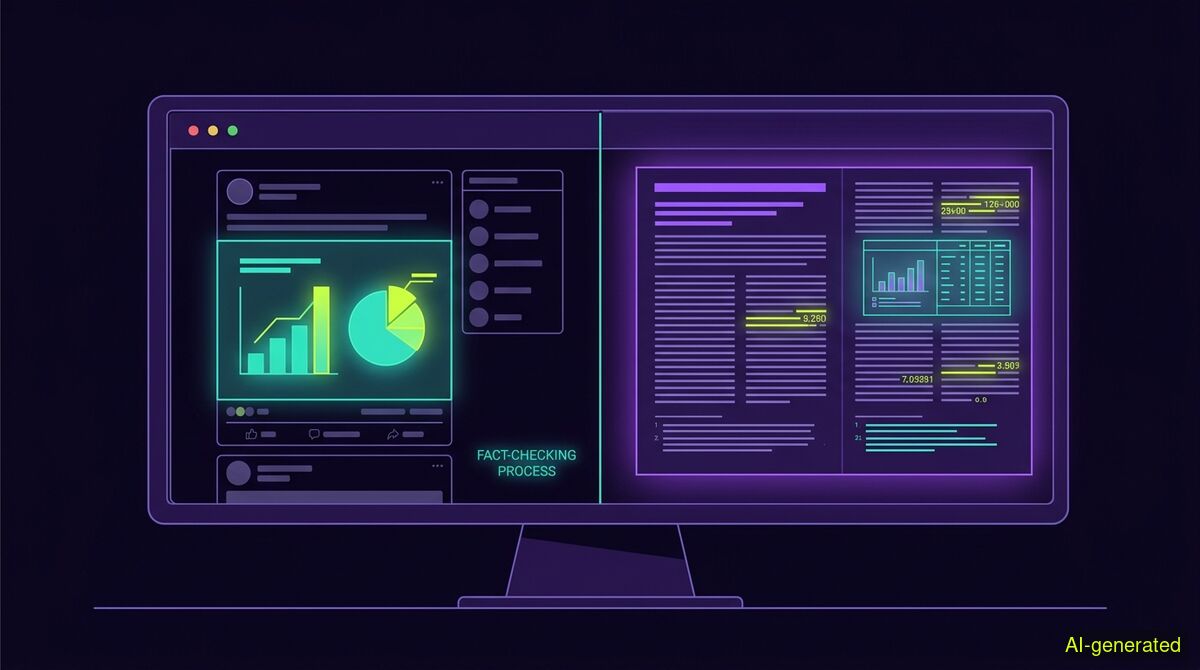
AI-generated illustration. A split computer screen showing a viral social media post with a chart on one side and a highlighted academic research paper on the other.
To fact-check a statistic, you must isolate the core number and trace it backward through its chain of citations until you locate the original dataset or primary study. A percentage without a verifiable root is meaningless, as numbers are frequently distorted by arithmetic errors, misleading charts, or missing context. Always verify the methodology before accepting a numerical claim.
A number dropped into an argument carries immediate weight. It looks precise, mathematical, and final. But before you can use it in a debate or a report, you need to know how to fact-check a statistic. A percentage or a data point without a traceable path to a primary source is not a measurement. It is just typography. When numbers travel across the internet, they shed their context, lose their methodology, and often change meaning entirely.
When a figure is repeated often enough, it achieves its own authority. Best News Links notes that figures sound authoritative simply by being cited, but they should never be repeated until traced back to the original report or dataset. Exact numbers are especially convincing. A figure like "$47,300 in ad spend" looks like a hard measurement, but as SociaVault explains, social media ad spend figures are often estimates wearing a measurement's clothes. Understanding the difference between a raw measurement, an estimate, and a complete fabrication requires walking the number back to its origin.
Many fake statistics are not invented out of thin air. They are born from simple arithmetic mistakes or misapplied data. A widely circulated claim stating that Covid-19 vaccination in the first trimester produced an 82 percent miscarriage rate was the result of a denominator error. As QuackeryWatch reported, the number was produced by dividing a study's miscarriages by the wrong group of women. The error was identified in 2021, but the number continues to circulate in official-looking documents.
A similar claim about tripled cancer rates relied on a US Department of Defense data error that underreported past rates. When the baseline dataset was corrected, the anomaly vanished. In both cases, the numbers looked real because they were derived from actual databases. The flaw was in the math, and you can only find that flaw by reading the original dataset.
To verify a number, you must understand its chain of custody. Dr. KPS Gill outlines a strict framework for this process. A claim is not verified just because many secondary sources repeat it. True verification means locating the controlling document or originating dataset, preserving its version and context, and narrowing the sentence to what that source actually supports.
The framework divides information into several distinct categories: original authority, official reproduction, derivative summary, commentary, quotation, and unsupported repetition. Most statistics shared on social media fall into the last two categories. The goal of fact-checking is to walk backward from an unsupported repetition to the original authority. If a post claims a specific percentage, you must find the embedded citation, locate the cited document, and then find the underlying dataset or study to check its version and context.
Sometimes the underlying data is perfectly accurate, but the label attached to it is entirely wrong. A chart showing a steep decline in a certain metric might use real data to tell a completely false story. For example, a graph was widely shared on X claiming to show the number of young adults identifying as transgender nosediving in 2022. As The Journal documented, the chart actually displayed data about bisexual women, not transgender children. The numbers were real, but they were attached to the wrong demographic to manufacture a trend.
In other cases, the comparison itself is the deception. When Donald Trump claimed his convention speech ratings beat the NFL, Poynter found that the claim relied on mixing traditional television ratings with millions of social media impressions. These are two completely different metrics that cannot be compared directly.
When you encounter a suspicious statistic, you need a systematic way to trace it back. Sopact recommends giving every released number a "Claim-to-Source Trail" that preserves the question being answered, the approved definition, and the exact supporting records. You can build this trail yourself by following a few clear steps.
First, isolate the core claim. Strip away the commentary and identify the exact number and what it claims to measure. Citely recommends exact-phrase searching as a first step to find the origin of a specific piece of text.
Second, look for the immediate source. If an article links to another news story instead of a study, follow that link. As Social Sci LibreTexts advises, popular news stories often embed links to their own older content to generate clicks. You must read carefully and click through until you hit the actual scientific paper or dataset.
Third, check the methodology. Once you find the primary source, look at how the number was calculated. Did the researchers survey ten people or ten thousand? Was the question phrased neutrally? Is the number an estimate or a direct measurement?
Tracing a statistic manually takes time. You have to open multiple tabs, dig through PDFs, and cross-reference datasets. To speed up the process, you can use the free wyper web app or the wyper Chrome extension. Both products return a truth score of 1 to 10 plus an evidence chain of real, linked sources. The truth score is not proof of trustworthiness, and the tool never judges intent. Both of those responsibilities stay with the reader.
When you submit a claim, the standard check runs a Dual-AI cross-check using Gemini and Grok. Grok searches for itself there, so the two models do not share one evidence set. Our own published measurements show the effectiveness of this search method. In a test of 633 real citations re-fetched by the system, 73 percent were found verbatim on the page. Another 19 percent of pages were unreachable for automated readers due to paywalls or PDF formats, and 6.4 percent were not findable. When testing source reach with 24 claims where the root was named in advance, the tool reached primary sources 63 percent of the time, legacy media 14 percent of the time, and fact-checkers 1 percent of the time, successfully finding all six non-English roots.
For deeper verification, the wyper extension offers a Full Spectrum check on paid tiers. This is a Triple-AI reading: three models, one evidence set. The third voice does not search. It receives exactly the sources the main model received and reads them independently. A disagreement here is a different reading of the same material, not a different search result. This distinction matters deeply. In our tests with 30 claims and frozen sources, Gemini and Grok agreed in 29 of 29 cases. Two models trained on overlapping text are correlated, not independent, so being confirmed by two AIs carries little information. However, a third model of different origin disagreed in 3 of 26 cases, every time with a machine-verified quote. This is the strongest thing we have, and it argues against a claim we used to make ourselves.
If a statistic is mentioned in a video, the wyper extension uses subtitles when reachable. When they are not, an AI model actually watches the video within a time window. The free tier covers 10 minutes on YouTube and 2 minutes on X, while Pro covers 30 minutes on YouTube and 7 minutes on X. Longer videos are refused outright, not partially checked. The web app cannot see the user's YouTube session, so subtitles are often unavailable there. For X videos, both tools take the same route. The system does not run deepfake pixel forensics, and it does not judge intent.
If the statistic is presented as a visual chart or a video clip, the web app includes an AI Spotter feature. Added for images on 11.08.2026 and for video on 27.08.2026, this is a provenance report, never a detector. It never outputs a percentage of how AI-ish something looks, because that number is the harm we exist to prevent.
It checks layers like content credentials against 55 official trust anchors, file metadata, reverse image search, earliest documented publication, and quote verification. For video, it takes still frames and searches each one separately. A hit on any frame is a hit on the video. Because a content credential sits in its own box beside the picture data, any repackaging drops it. Platforms repackage files on upload, so a missing credential on a social media video is the normal case, not a suspicion. The report says so plainly. What carries the weight for video is earliest appearance plus the event-versus-post date gap. Note that the AI Spotter calls three paid services on every run, so it is not in the free tier and requires paid credits, unlike the text fact-check which remains free.
There is also a public dispute register for checked claims. It is append-only and hash-chained, so entries cannot be silently edited or removed.
| Feature | Manual checks | wyper web app | wyper extension |
|---|---|---|---|
| Price | Free | Free tier available | Free tier available |
| Installation | Nothing installed | Nothing installed | Requires Chrome extension |
| Data privacy | No data leaves the browser | Text sent to server | Text sent to server |
| Evidence chain | You build it yourself | Automatic linked sources | Automatic linked sources |
| In-page checking | Copy and paste required | Copy and paste required | Checks text directly on the page |
| Video checking | Manual transcript search | Subtitles only | AI watches within time window |
| Deepening | Read multiple papers yourself | Not available | Full Spectrum (Triple-AI reading) |
Who needs which: Casual readers who want to verify a single suspicious number in a news article should use the wyper web app, which requires no installation or signup. Researchers, journalists, and power users who regularly encounter contested statistics on social media platforms or in video feeds are better served by the wyper extension, which checks claims where they appear and offers the Full Spectrum reading. Those handling highly sensitive internal corporate documents should stick to manual checks to ensure no data leaves their machine.
A statistic is only as reliable as the primary source dataset it comes from. You must always trace a number back through its chain of custody to verify its context and methodology. Whether you do this manually or use an automated evidence chain, never trust a percentage that lacks a verifiable root.
The wyper Fact-Check extension runs these checks on the post itself: truth score, evidence chain, and the date gap that catches recycled footage.
The web app installs to your home screen in one tap. No store, no account.
Already using it? ★★★★★ Rate it on the Chrome Web Store. Reviews decide what others get shown first.
 wyper
wyper